Portfolio
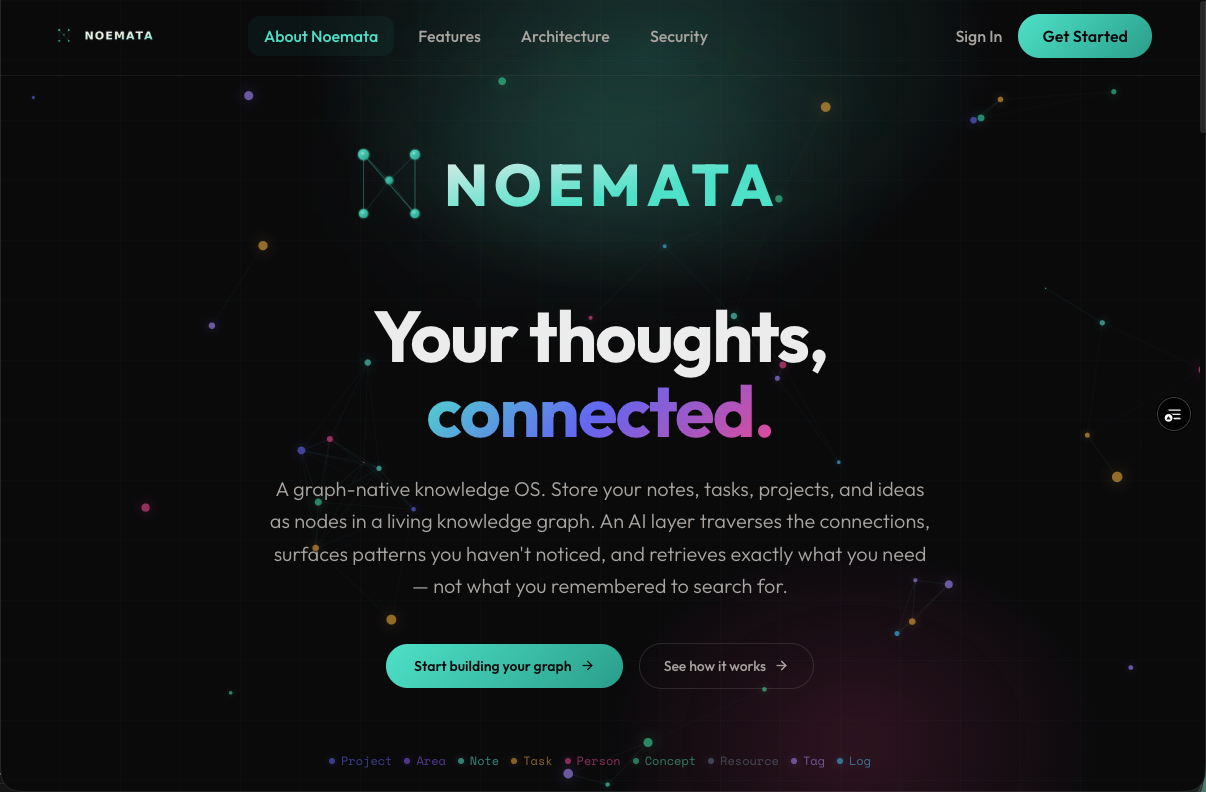
Noemata: AI-Powered Personal Operating System
A full-stack application integrating LLM intelligence with a structured GraphRAG data backbone. Everything in Noemata is a node. Notes, tasks, projects, people, concepts: all connected in a living knowledge graph that an AI layer traverses, links, and makes sense of for you.
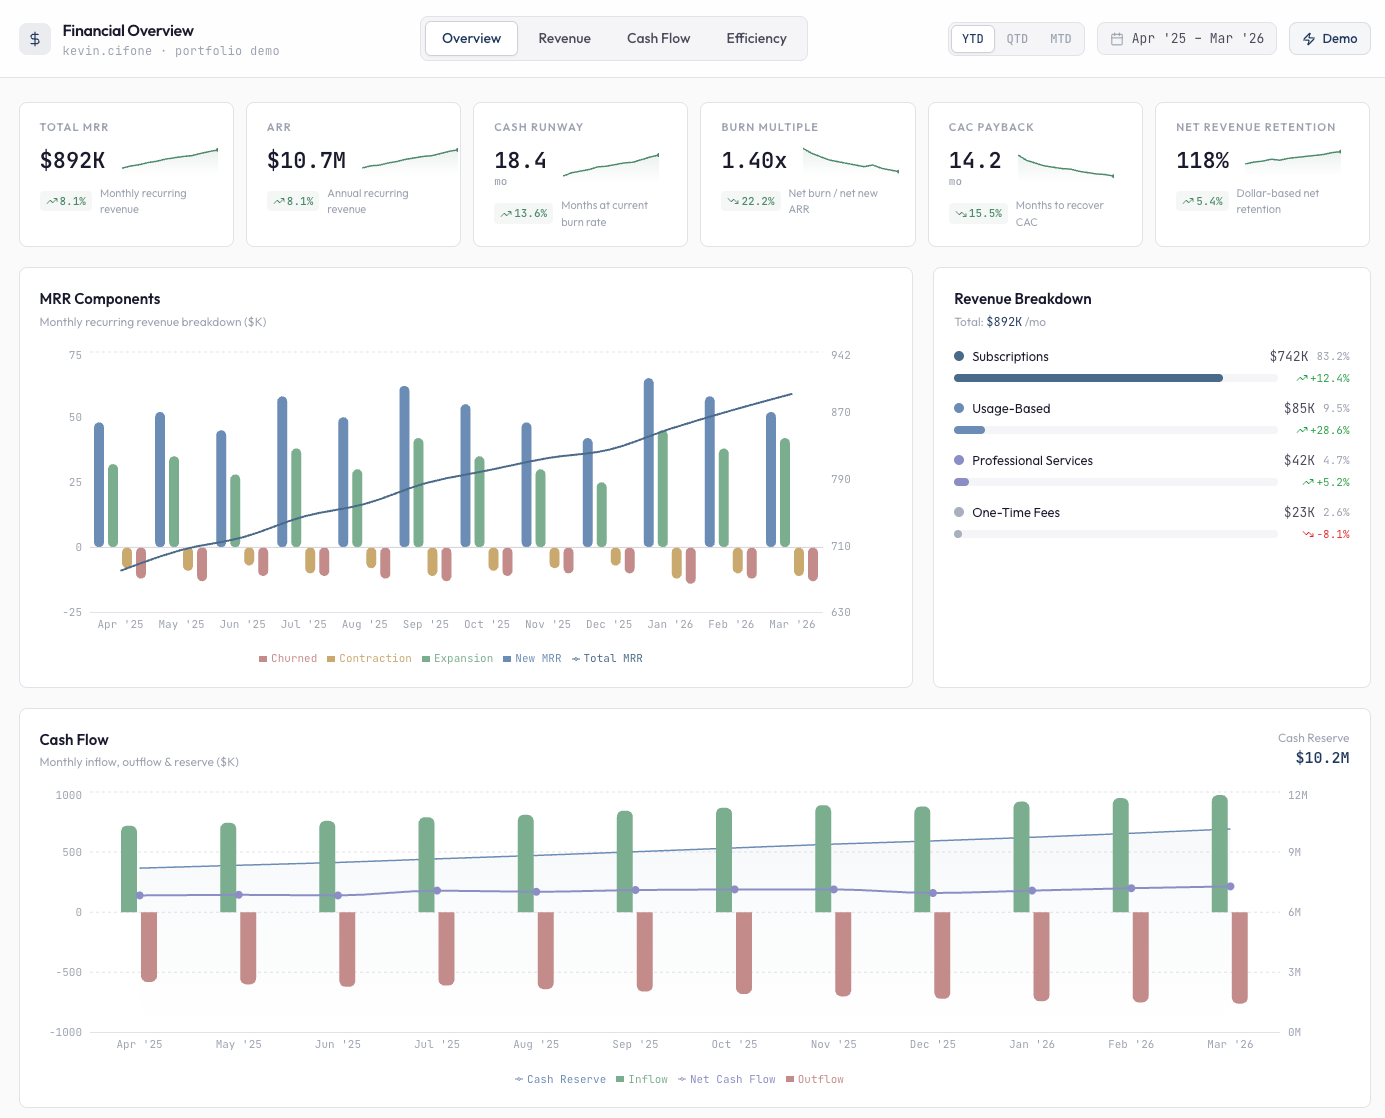
Executive Financial Dashboard
An interactive financial dashboard for a fictional Series B SaaS company (~$10M ARR). Features six animated KPI cards, MRR component breakdowns with dual-axis charting, cash flow visualization, a P&L variance heatmap, unit economics bullet charts, and AI-powered insights. Built with Next.js 16, TypeScript, Recharts, D3.js, and Tailwind CSS.
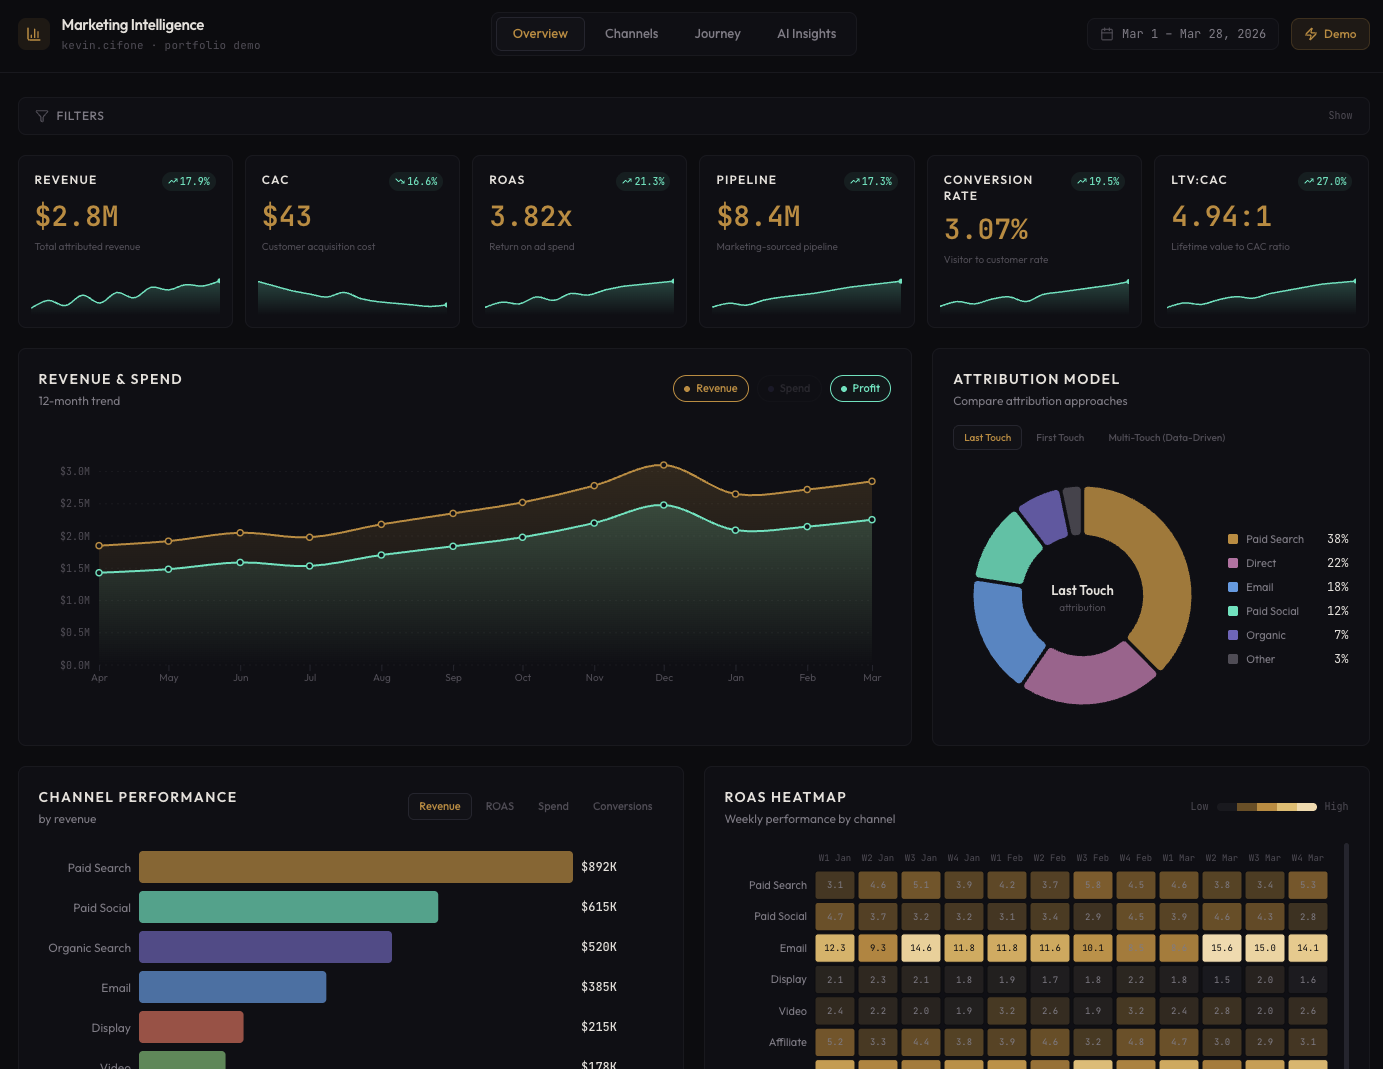
Marketing Intelligence Dashboard Demo
An omnichannel marketing analytics dashboard built from scratch with Next.js, D3.js, and Tailwind CSS. Six custom D3 visualizations (area charts, Sankey flows, heatmaps, donut charts) render realistic mock data across revenue, channel performance, multi-touch attribution, and audience segmentation. An AI-powered insights panel surfaces anomalies, trends, and opportunities with impact scoring and expandable detail cards.
![[WIP] Talent Acquisition Dashboards Demo](https://piwecmfnexhpcsxnfnnq.supabase.co/storage/v1/object/public/project-images/projects/1774239943911.png)
[WIP] Talent Acquisition Dashboards Demo
An end-to-end talent acquisition and onboarding analytics suite built on mock data. Five interconnected dashboards follow the full hiring lifecycle from sourcing channel ROI through pipeline conversion, req fulfillment, and new hire experience. Designed for an executive-level audience. Built in Tableau with a custom dark-theme design system, branded navigation, and a narrative structure that moves from strategic KPIs to diagnostic detail.
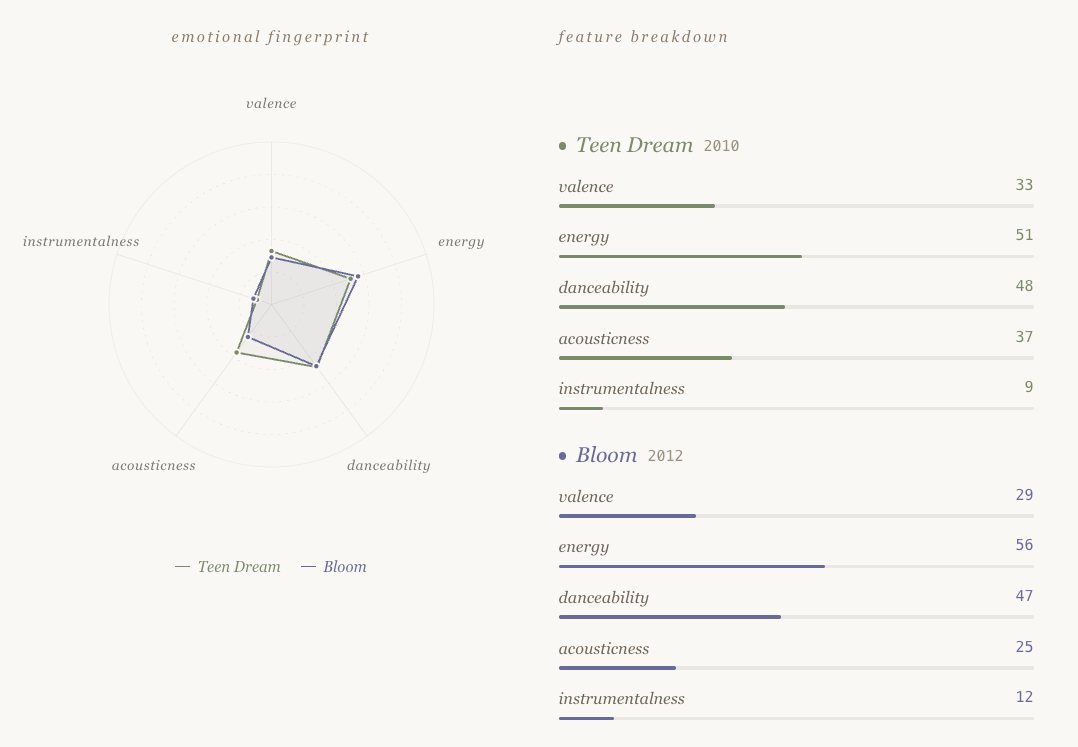
Sound & Feeling: an emotional cartography of Beach House
Built as a passion project, Sound & Feeling maps audio features (valence, energy, danceability, acousticness, instrumentalness) across Beach House's complete studio discography (2006–2022) to reveal the emotional architecture of their music. Audio features are sourced from Spotify's audio analysis methodology.
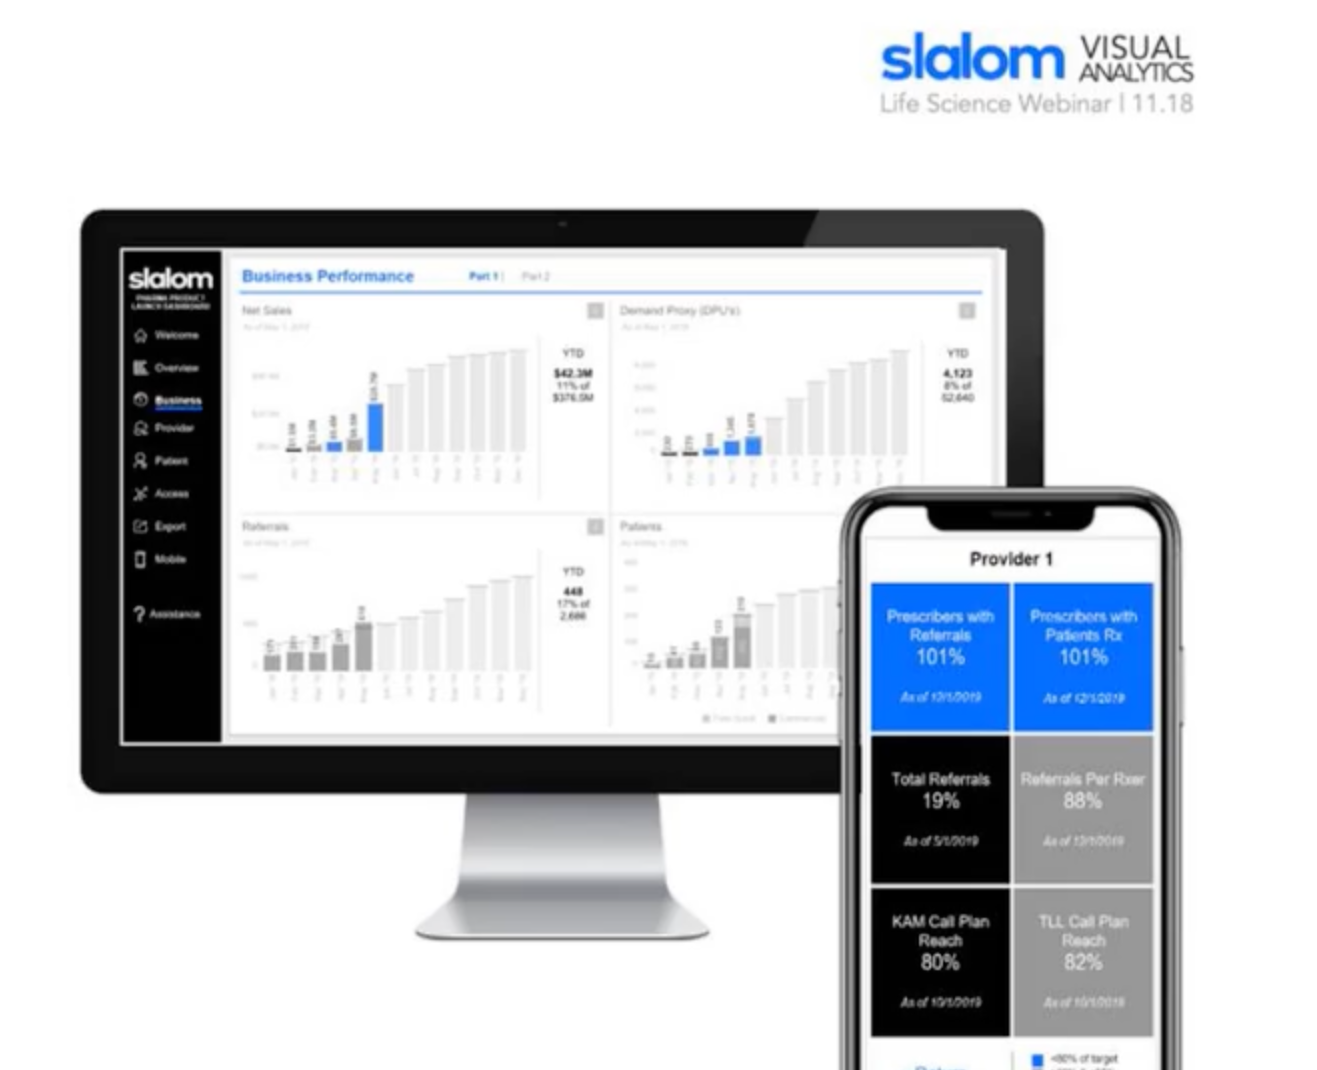
Tableau Webinar: Pharmaceutical Launch Best Practices
Presented alongside Slalom consulting colleagues in a webinar on how visual analytics power pharmaceutical launch strategy. Our team designed a suite of Tableau dashboards that enabled cross-functional teams to track and act on critical data during the high-stakes post-FDA-approval window, turning complex launch metrics into clear, actionable reporting. The session covered best practices in combining data, design, and strategy to build analytics solutions for life sciences organizations.